March 20, 2024
3 minute read
Our recent retail media benchmark shows brands are allocating 15.5% of their total marketing budgets to retail media.
While that figure is steadily increasing, digital leaders still view their retail media budgets (and broader resources) as limited, especially relative to the number of retail media networks (RMNs) knocking on their door.
This is keeping funds concentrated on a small number of RMNs that offer brands scale, solid performance, and robust advertising and reporting capabilities – including Walmart.
In this follow-up benchmark, we cover investment levels into Walmart Connect specifically.
Read on for intel on recent performance with Walmart Connect, how much brands currently invest into the RMN, and how that is expected to change over the next year.
Key Stats
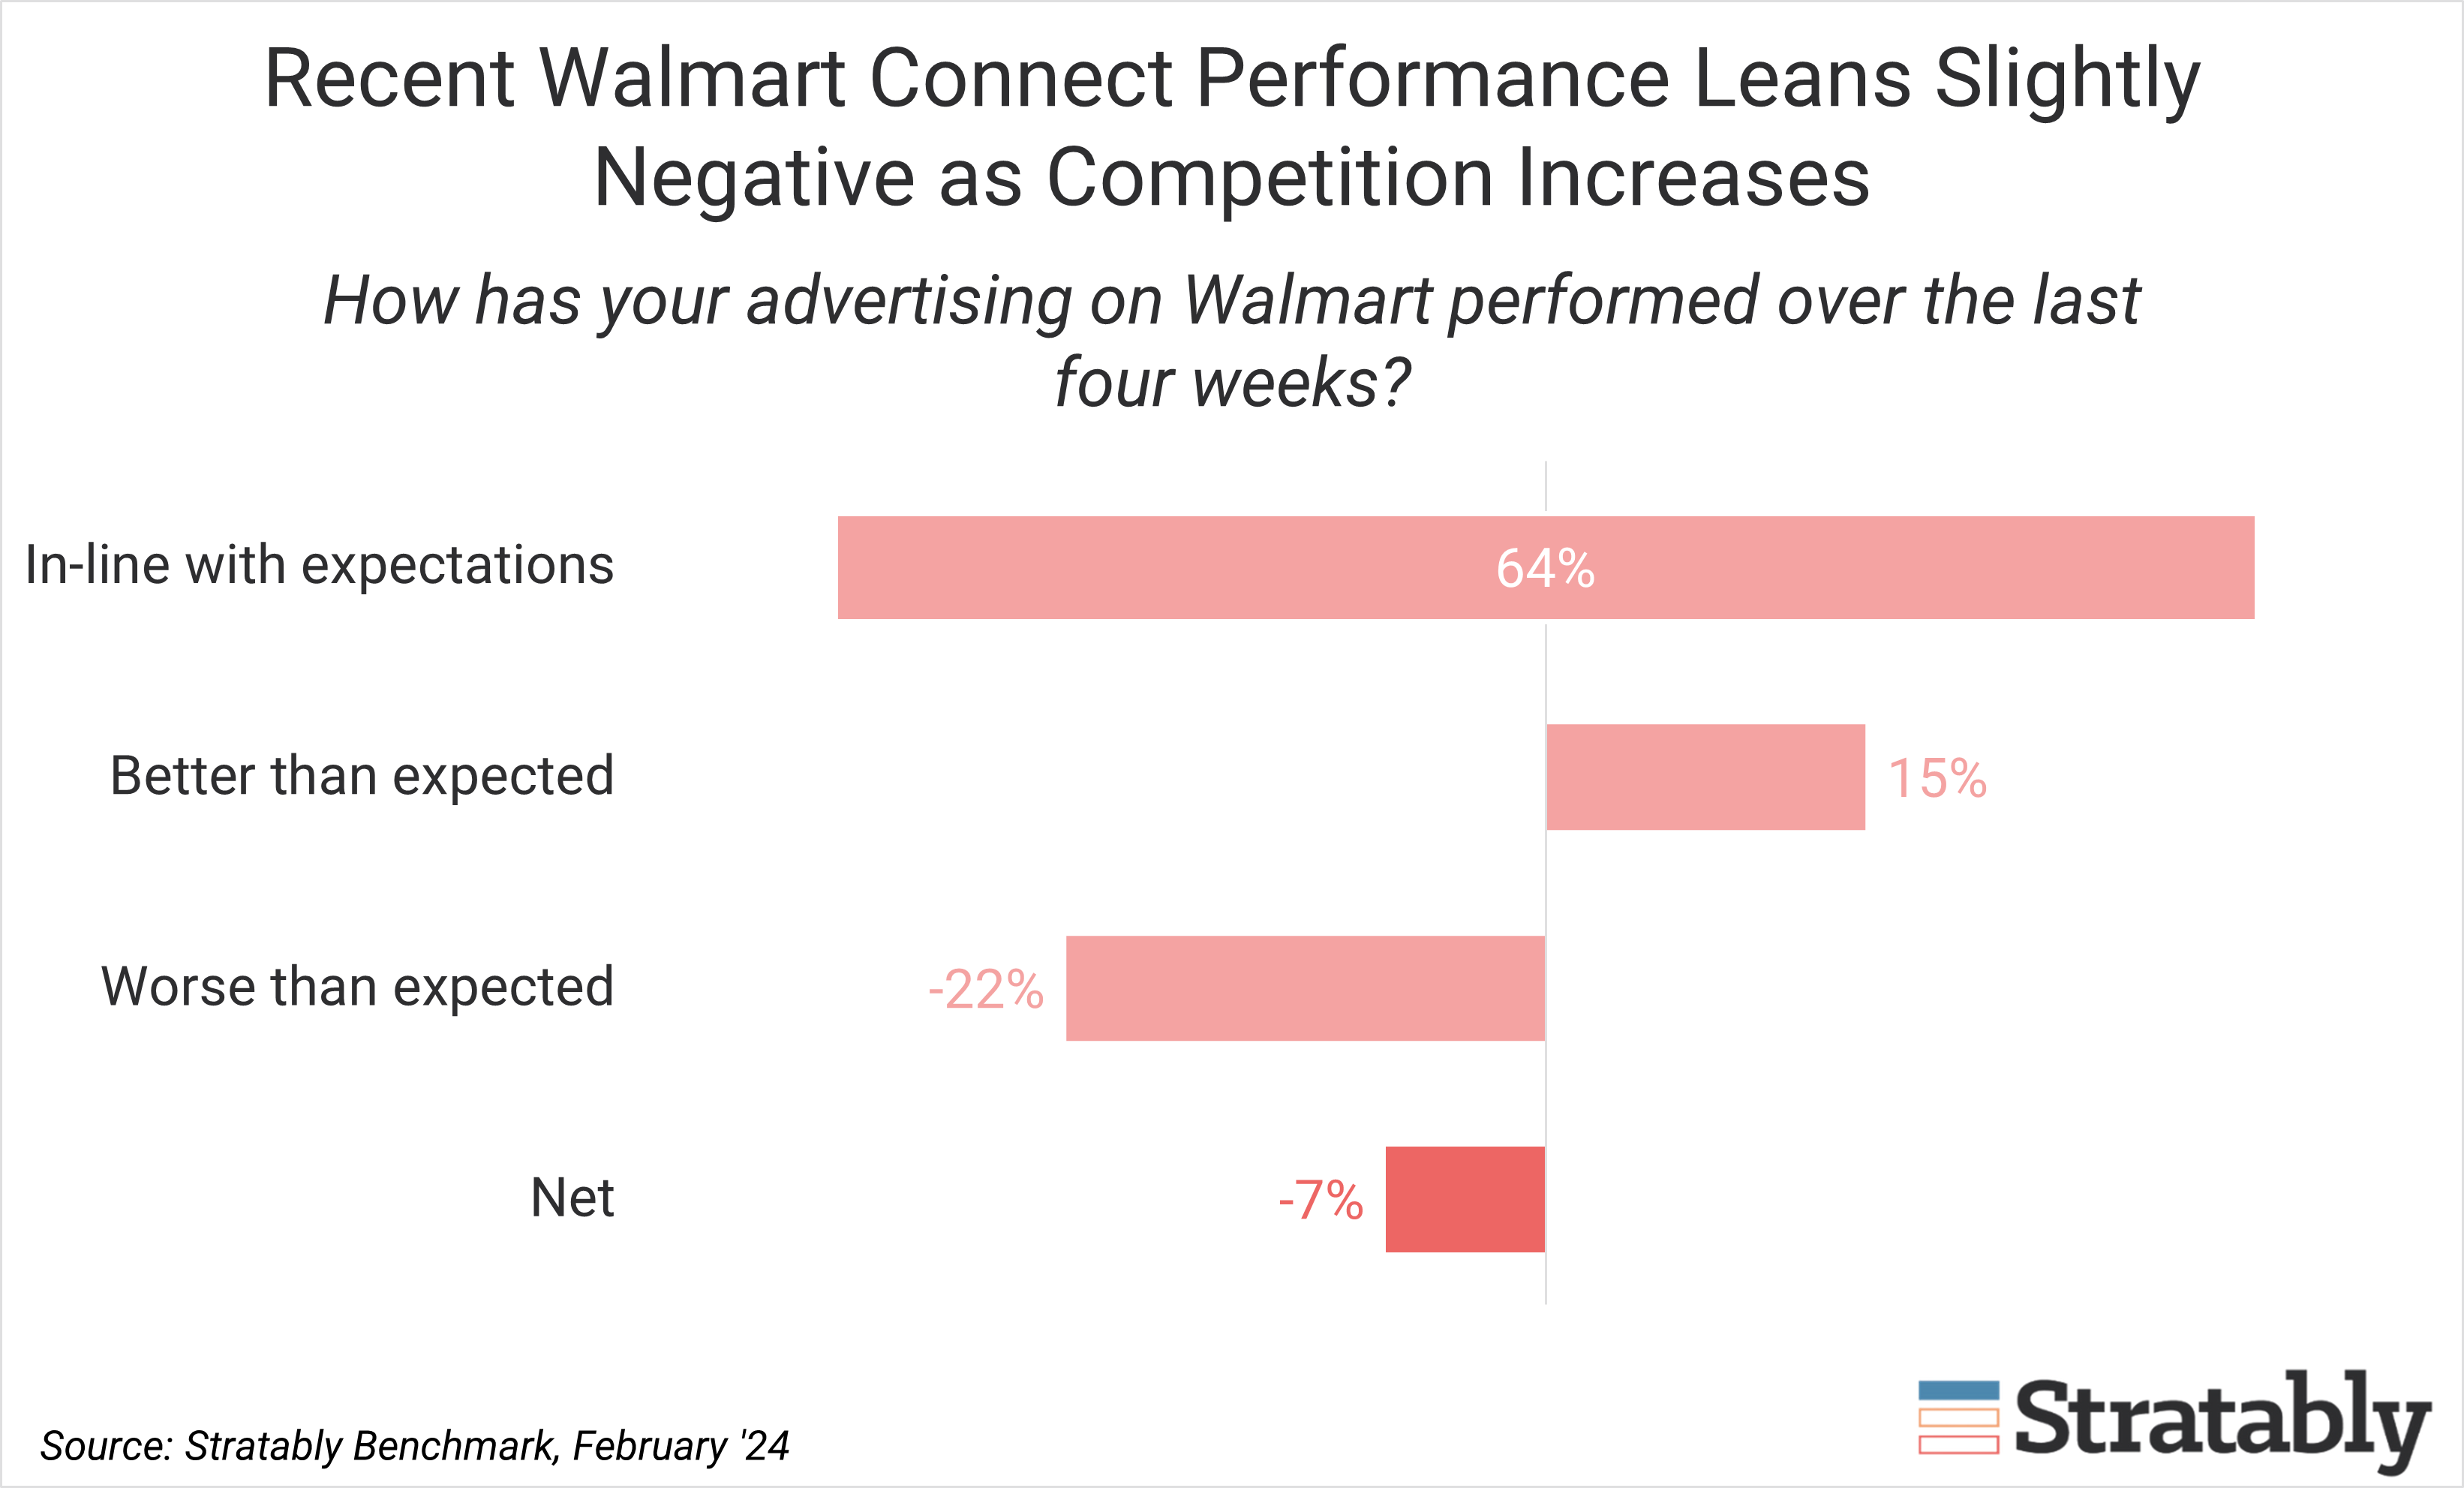
- Recent ad performance was worse than expected for a net -7% of brands as competition increases on the platform.
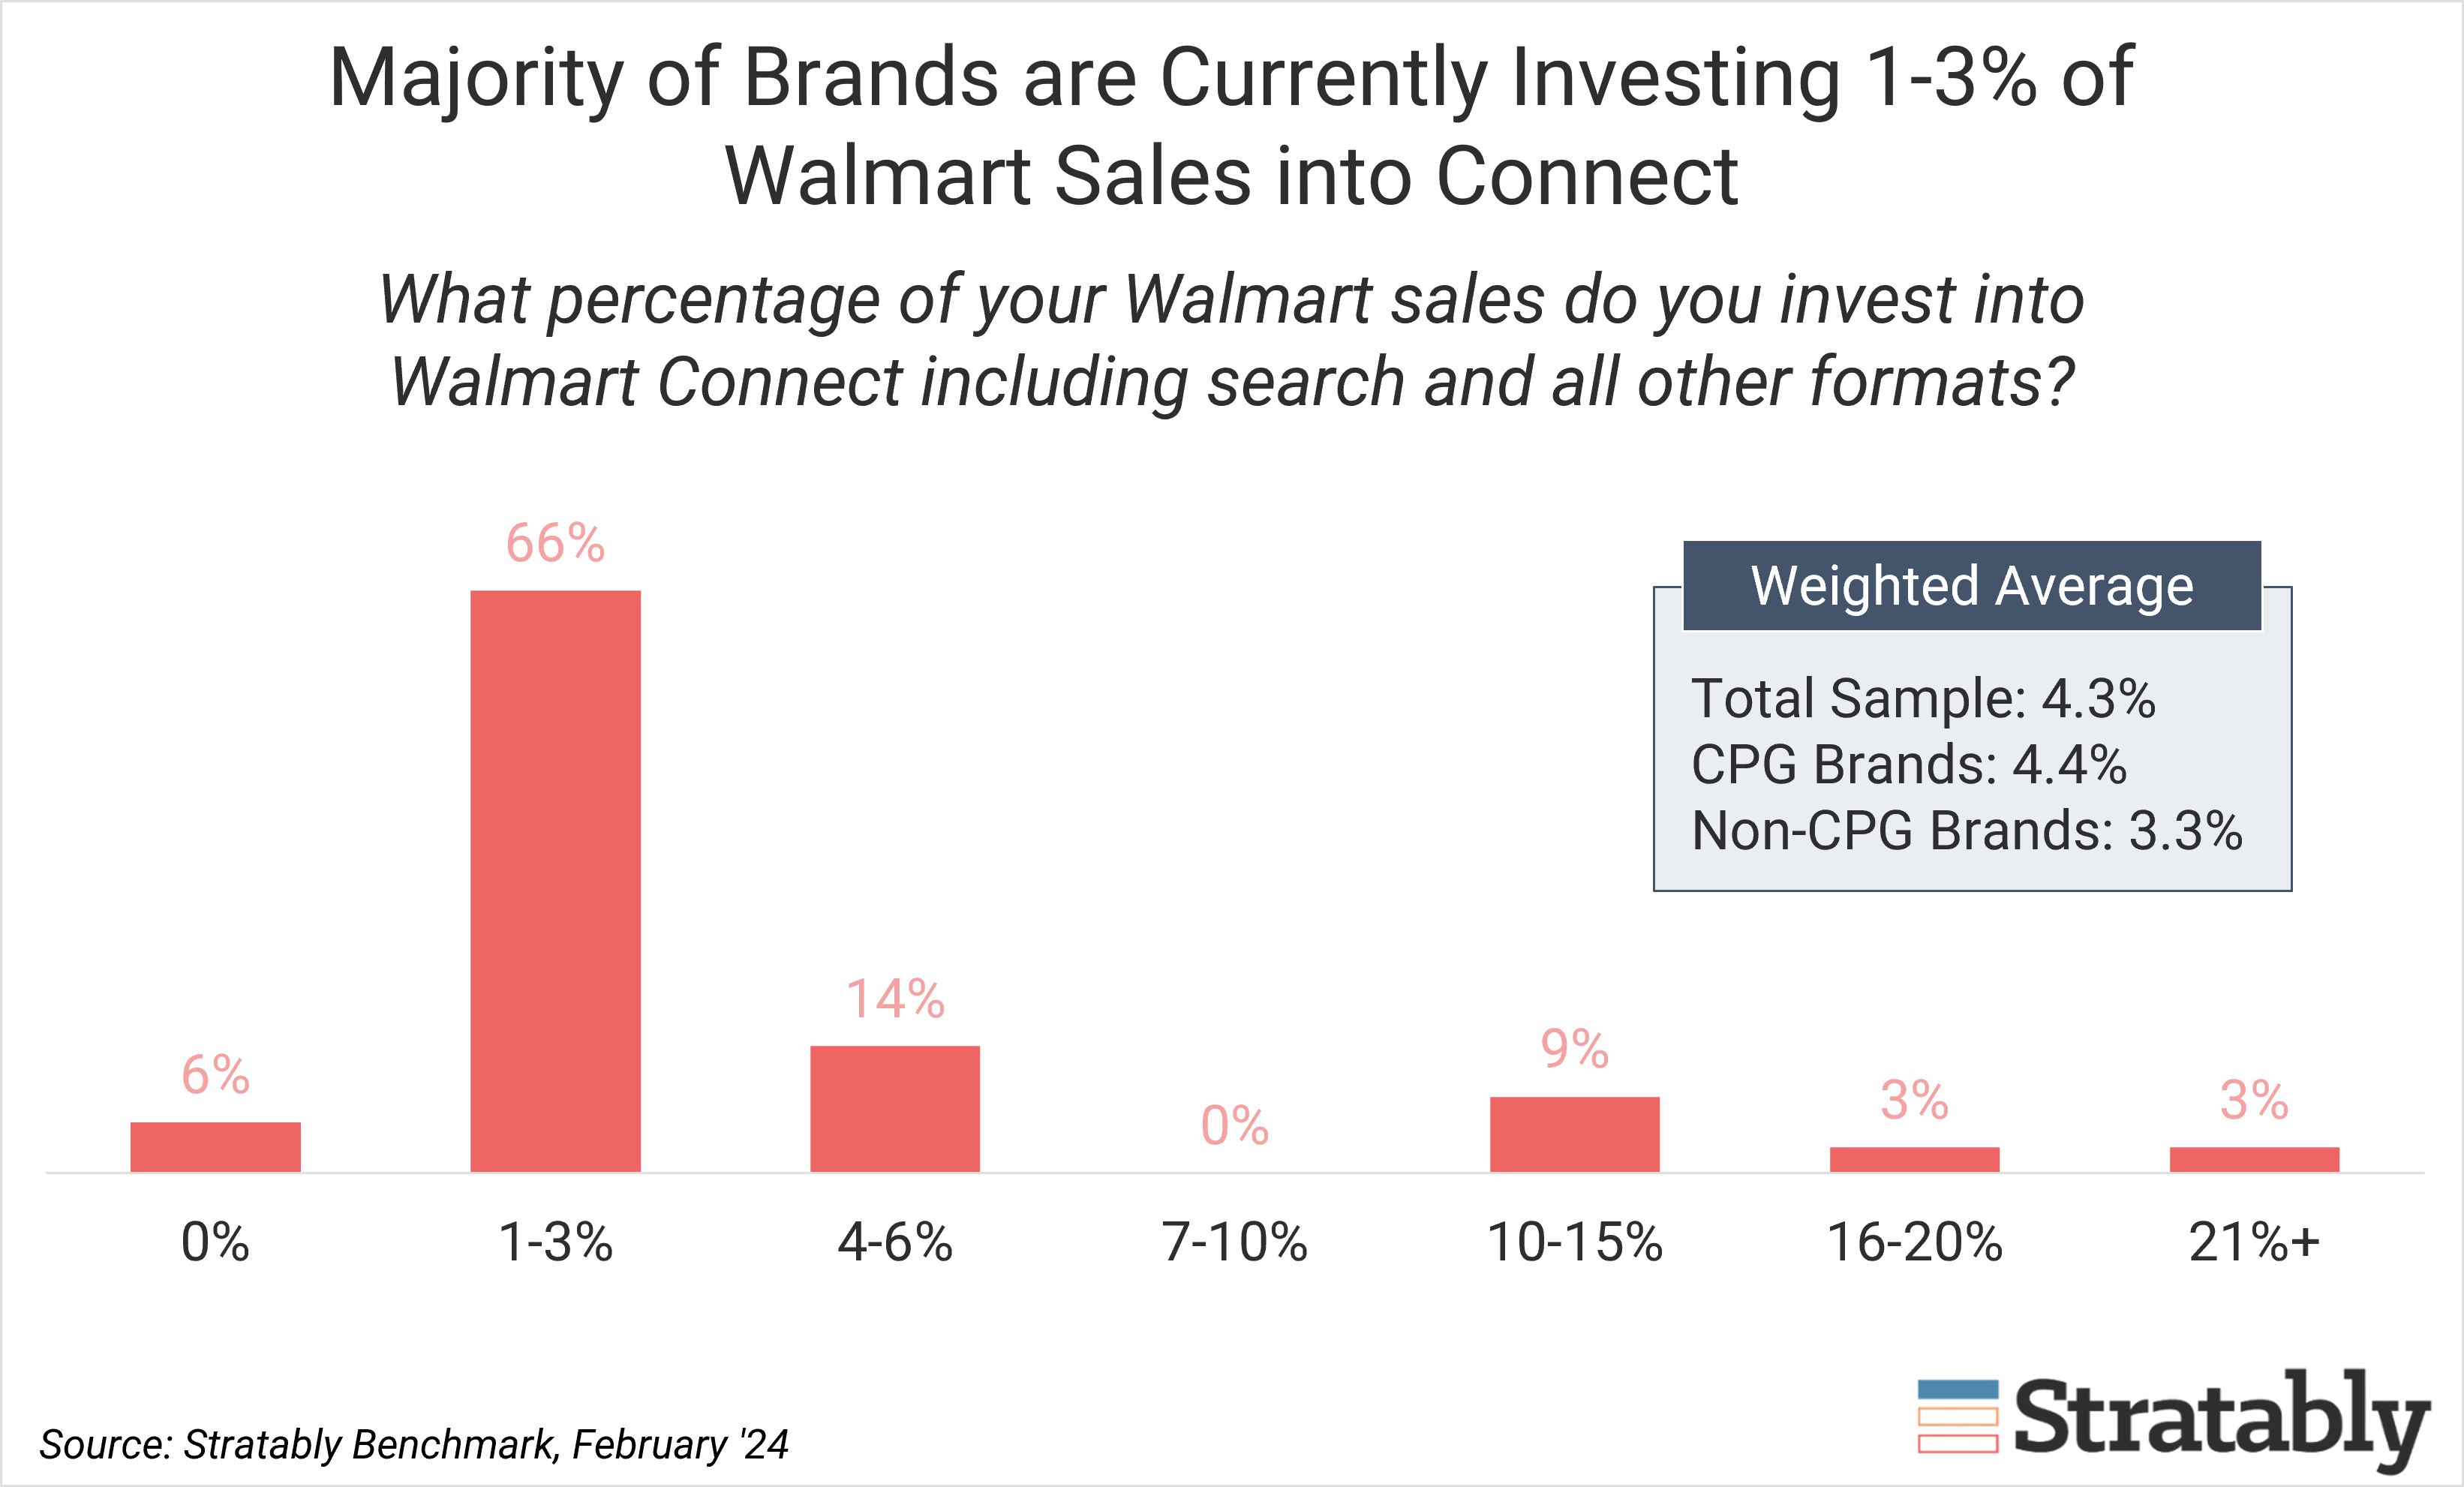
- 66% of brands in our benchmark are currently investing 1-3% of Walmart sales into Connect, while the total weighted average across the sample amounted to 4.3%.
- A net 24% of brands are increasing investment levels in 2024, particularly those that have seen better-than-expected performance and/or those that are currently spending less than the industry average.
Recent ad performance leans slightly negative as competition increases.
According to our benchmark, ad performance over the last four weeks has performed better than expected for 15% of brands, worse than expected for 22% of brands, and in line with expectations for 64% of brands.

The negative net -7% data point speaks to increasing Walmart Connect competition more so than softening sales, as brands report modestly positive sales performance over the same period.
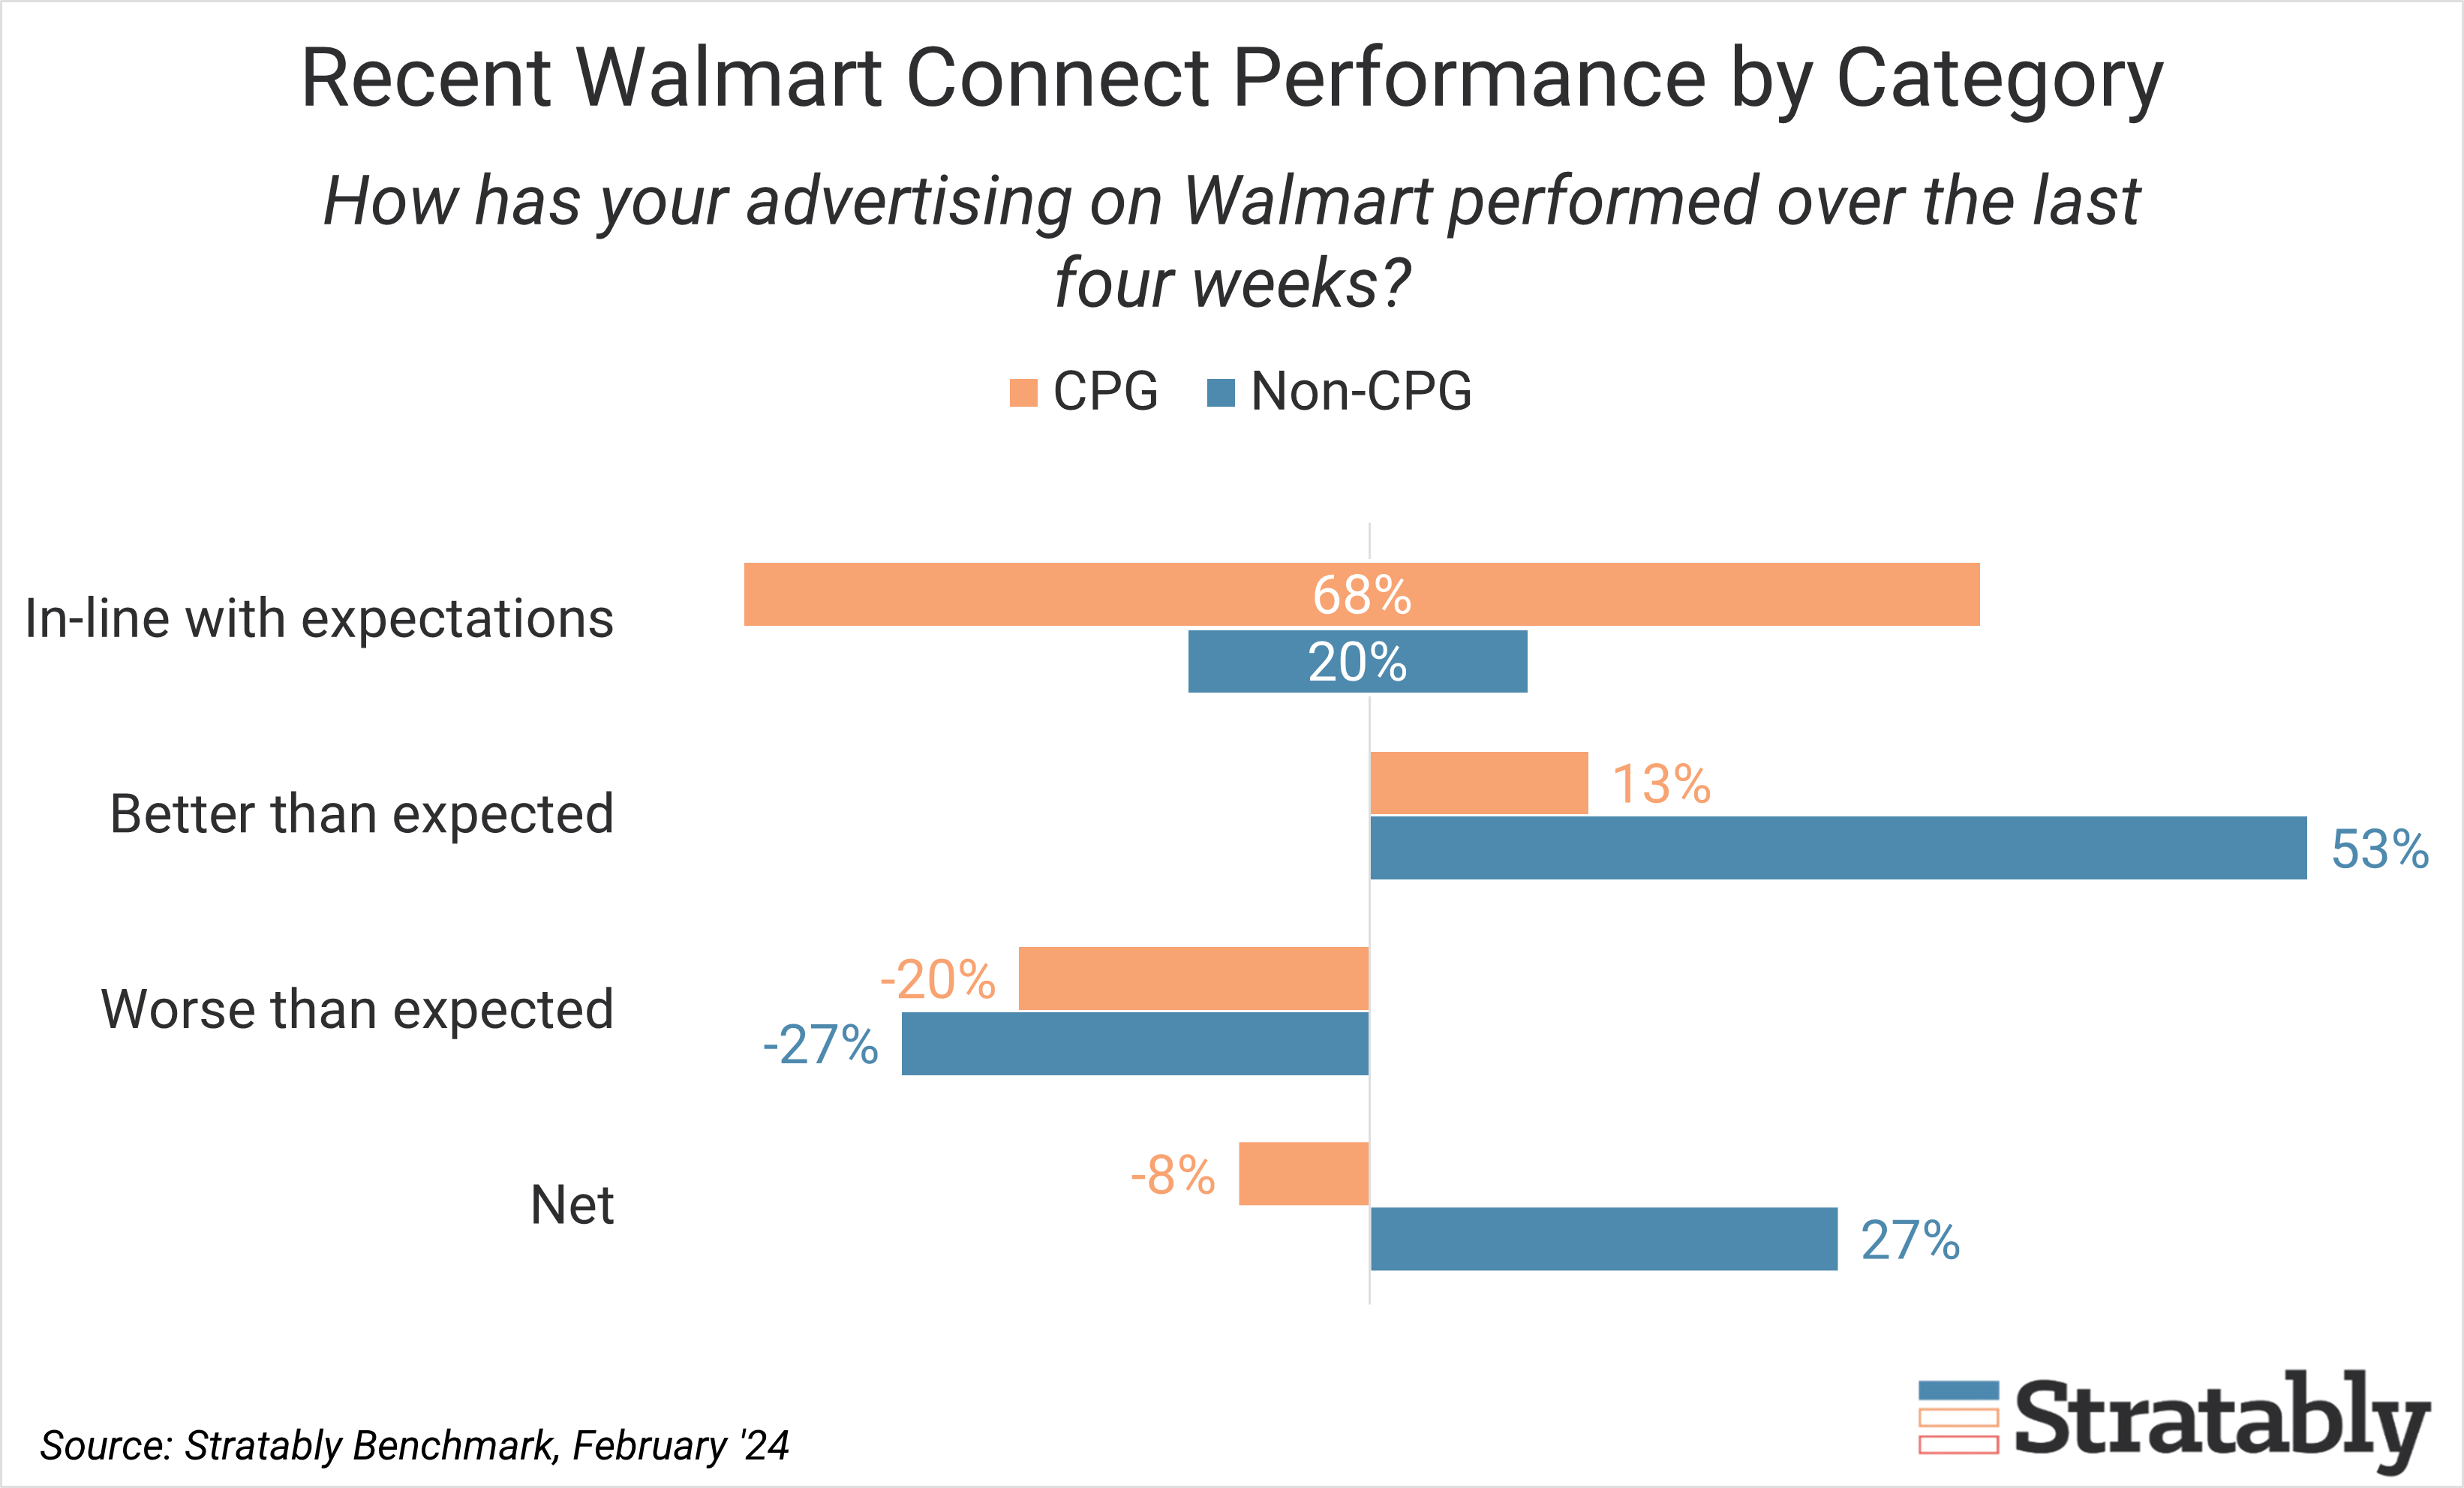
CPG brands report seeing worse ad performance than non-CPG.

66% of brands are currently investing 1-3% of Walmart sales into Connect.
The majority of brands are investing 1-3% of Walmart sales into Connect, with a weighted average of 4.3%. Our benchmark sample skews towards large consumer brands with established budgets and significant focus on winning at Walmart, so this datapoint likely trends higher than the average industry-wide investment level on Walmart, which we estimate to be around 1-2% of sales.

CPG brands are spending 110 bps more than non-CPG brands as a percentage of sales on average. This categorical trend holds true for Amazon Ads too, although total investment levels on Amazon are much higher as a percentage of sales.
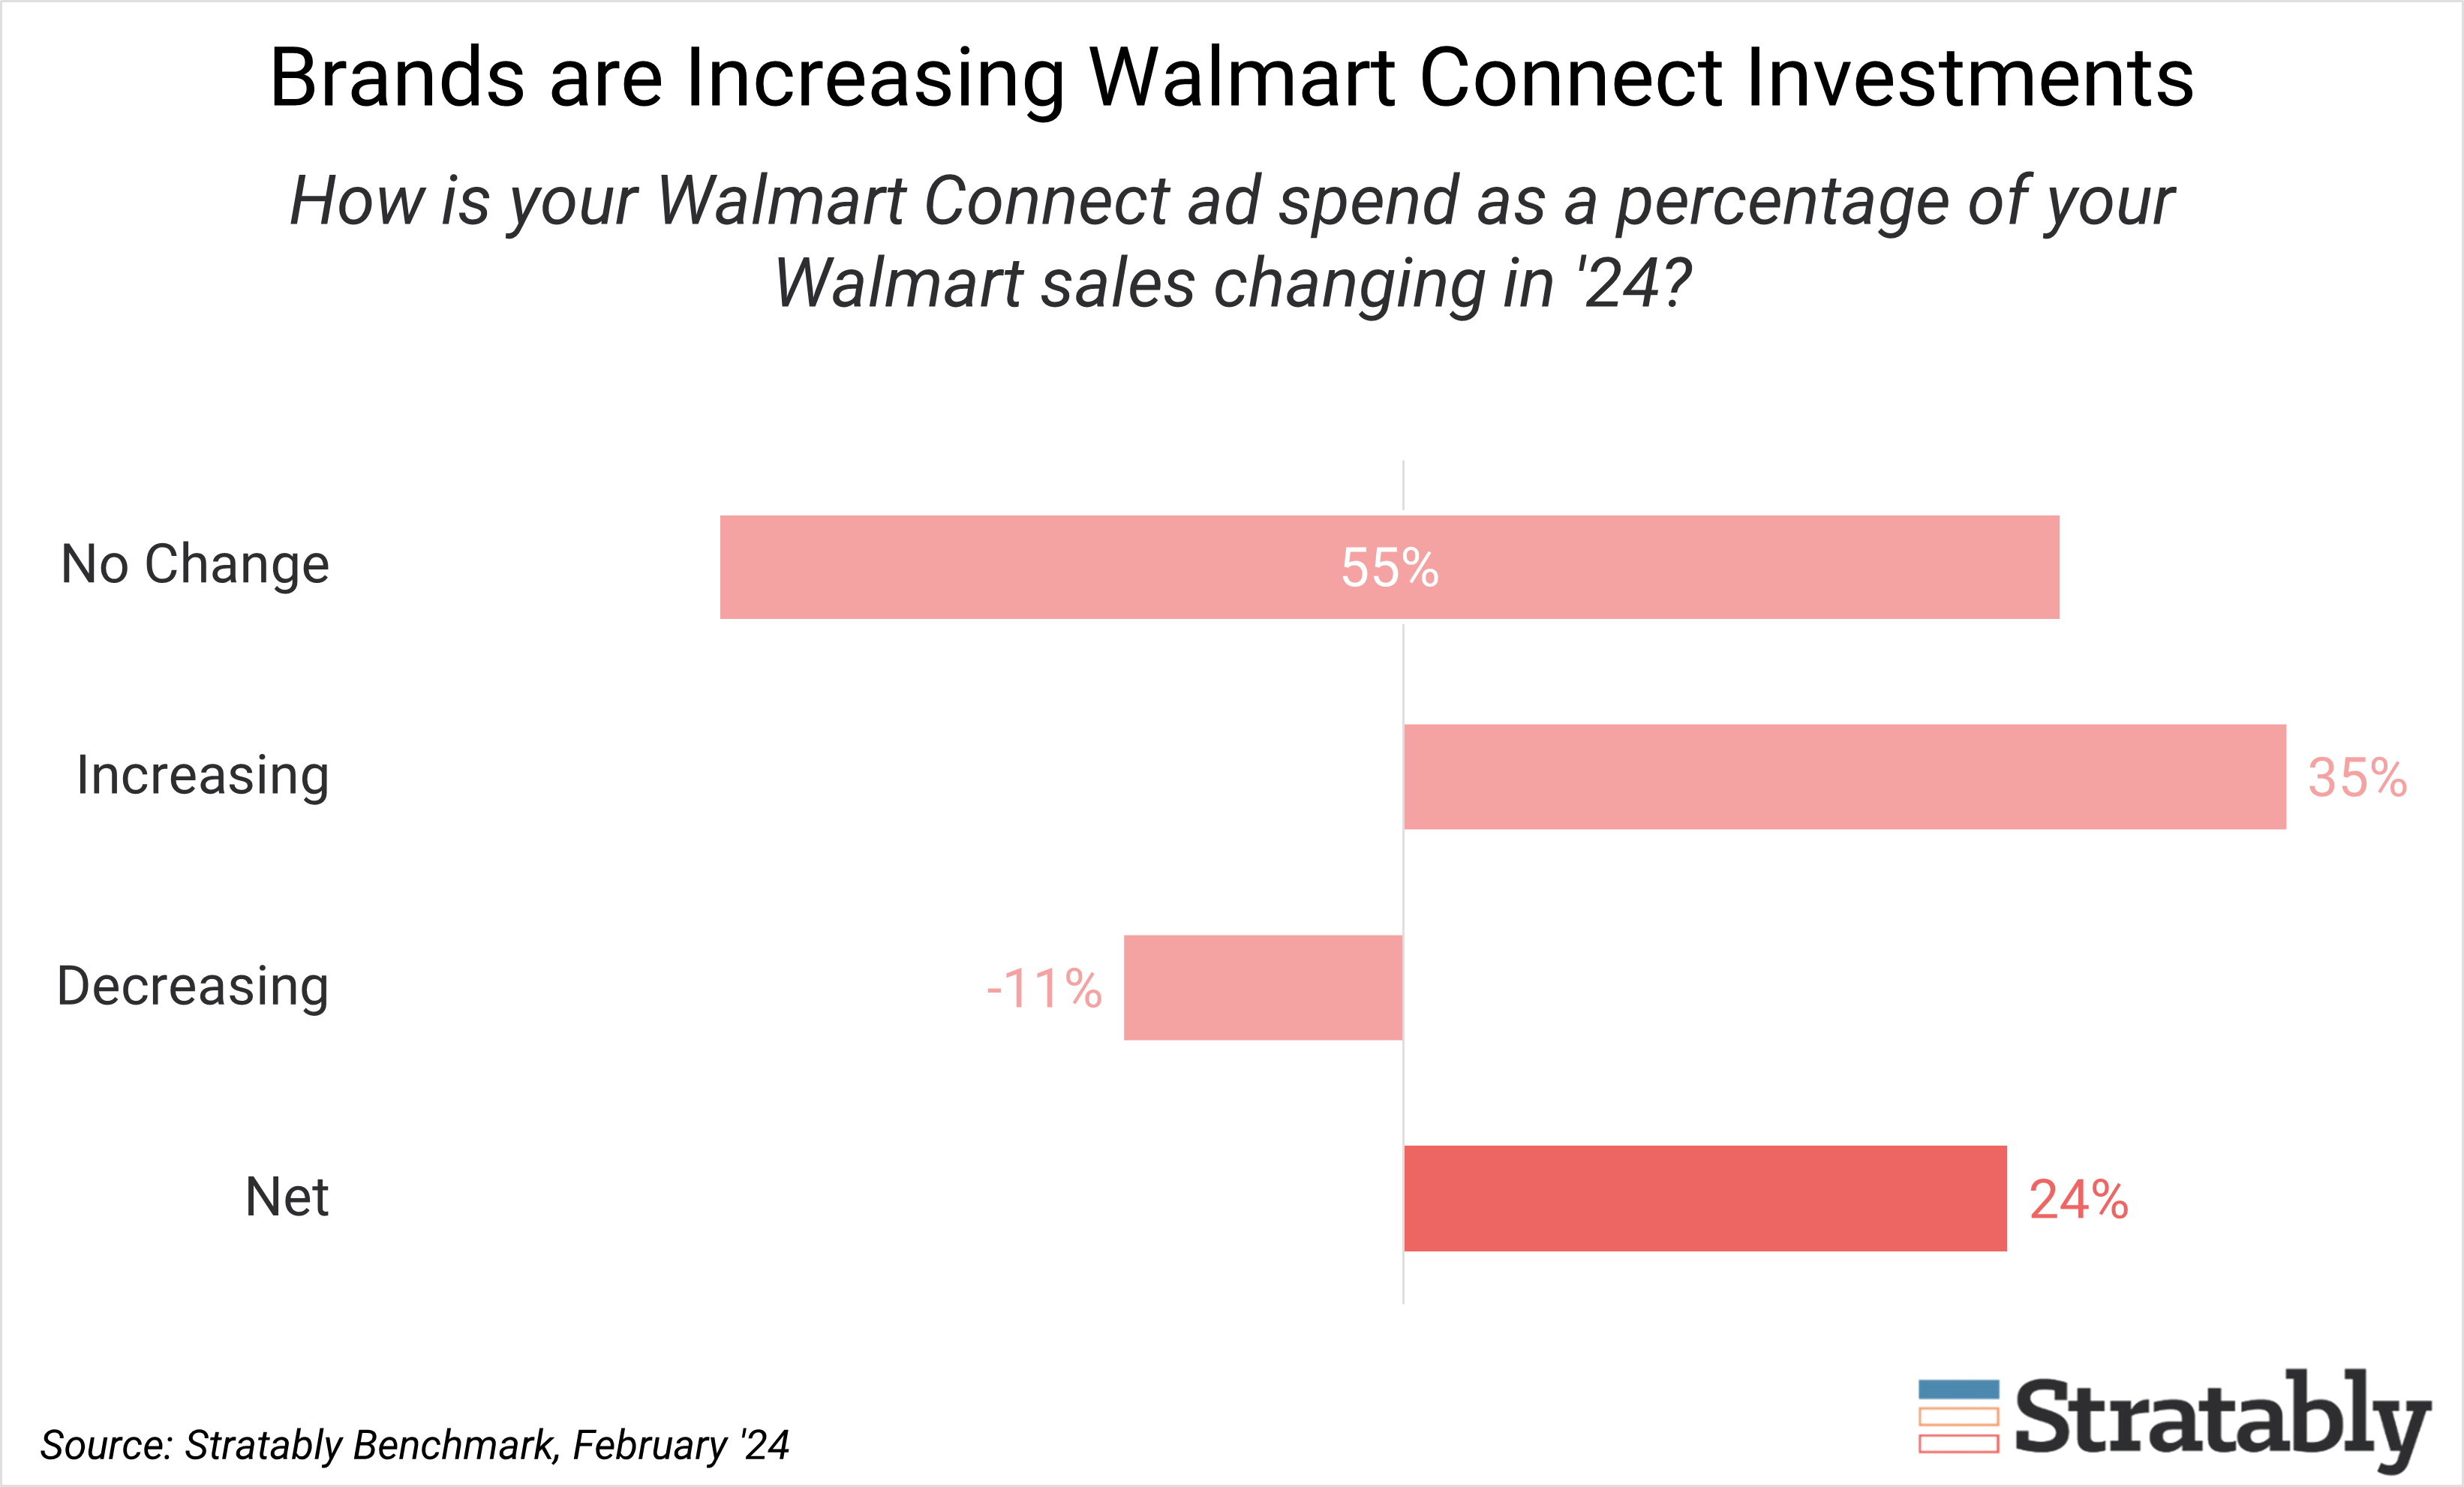
A net 24% of brands are increasing investment levels in 2024.
According to our benchmark, brands should plan for more competition on Connect, as 35% of brands report increasing their spend as a percentage of sales compared to 11% decreasing for a net +24%.

Said another way, three brands are increasing spend for every one brand decreasing spend as a percentage of sales. And 55% of brands are keeping investment levels steady in 2024.
CPGs are slightly more likely than non-CPG brands to be increasing spend.
Within our benchmark data, we see two key indicators of investment level changes:
First, current investment rate: Those brands below the average investment rate of ~4% of sales are 1.5x more likely to be increasing their spend this year (i.e. playing catch-up).
Second, performance: Those that report recent ad performance was better than expected are nearly 4x more likely to be increasing spend this year compared to those with worse-than-expected performance.
This is because brands are often planning quarters or half-years at a time, looking at past performance to set budgets. Brands with nimble and more responsive budgets can enjoy a competitive edge by taking advantage of real-time trends in sales and ad performance.
Our broader research suggests Walmart’s high investment asks coupled with its strategic importance to brands are also driving an increase in spend, in addition to its broad-based reach and the ability for brands to put media dollars to work at scale compared to smaller retail media networks.
Related Reading on Walmart
- Walmart Luminate and Connect – updates and best practices
- Benchmarking on recent Walmart sales performance
- Analyzing Walmart’s 4Q23 results


