August 3, 2023
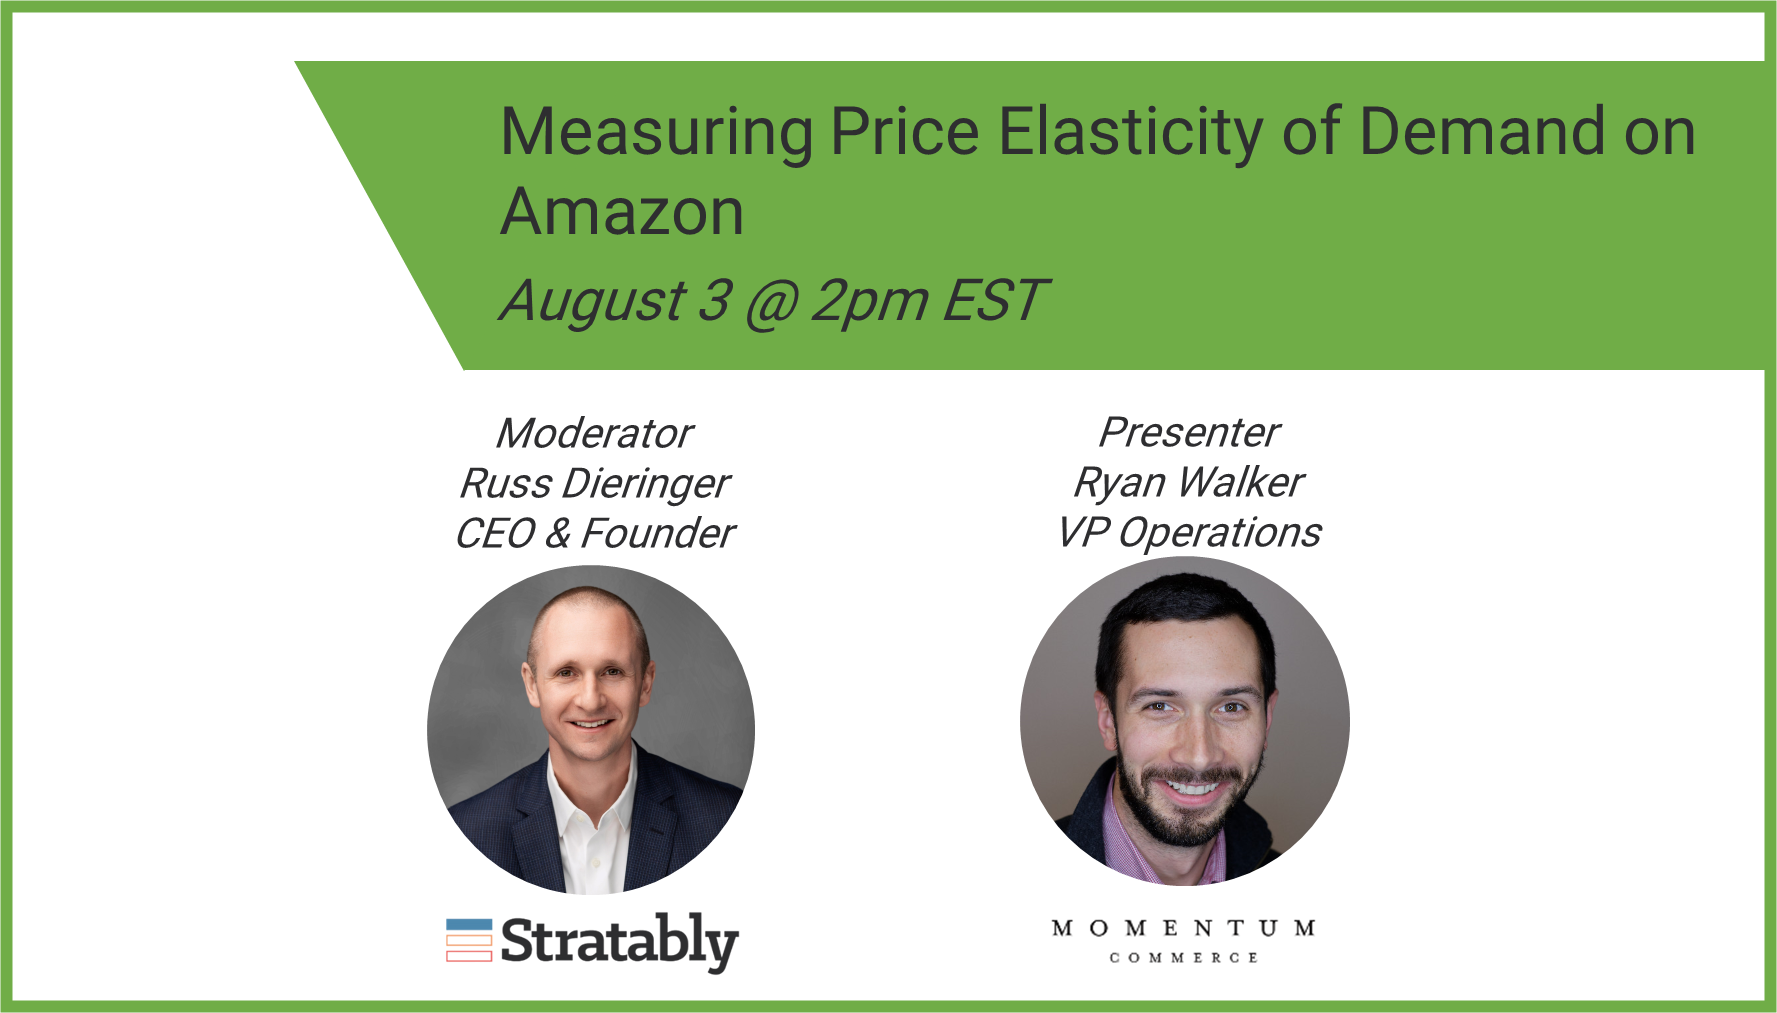
Stratably hosted Ryan Walker from Momentum Commerce to share examples of how pricing tests on Amazon can be used strategically to fuel profitable growth, including shifting the demand curve of a product.
Key topics included:
- Defining demand elasticity
- How to approach challenges to measuring it
- Best seller badge conquesting via pricing
- Designing elasticity tests
- Pricing and promotional expectations for 2H23
Watch The Recording Here
Our action items for brands following the live session:
- Review (or determine for the first time) the demand elasticity of our priority ASINs
- Ensure our pricing team understands the fast pricing feedback loop available on Amazon
- Identify which ASINs are close to winning the best seller badge and see if pricing can help us shift the demand curve
- Update our promotional, advertising and financial plans for 3Q/4Q in anticipation of a more competitive environment
Here’s what we found most interesting:
- Importance of price elasticity: Examining price elasticity shifts the focus towards unit economics and maximizing profit on Amazon rather than higher level KPIs that can mislead a brand. Importantly, since competition is typically more intense and different on Amazon compared to a brick and mortar setting, elasticities will likely be different (often more elastic). Elasticity models should be run regularly (weekly or monthly) to ensure the curves are not changing drastically, while pricing changes (once the optimal price is found) will occur less often. In other words, elasticity monitoring is an always-on type of activity.
- Clean pricing data is important: In order to optimize price, brands need enough data to understand elasticity. This can be created through carefully designed tests that minimize noise and incrementally raise or lower the price to see how demand responds. High signal data can be difficult to develop because of activity outside of pricing changes that can change demand, such as multiple sellers competing for the buybox, advertising changes, competitors changing their price, and for 1P brands, less ability to influence price.
- Options for 1P brands: While Amazon controls the price of its 1P inventory, 1P brands can offer coupons, discounts via subscribe and save, and also change the price they sell to Amazon. The latter option will not necessarily allow a brand to measure elasticity well though. Further, products with a great deal of price matching will struggle to test elasticity well.
- Best seller badge conquesting: Momentum Commerce’s elasticity tests have revealed the ability, in some cases, to reduce price temporarily to win a best seller badge. Once the badge is won, they have found the price can be brought back to the pre-deal price and the product tends to retain the badge, helping fuel more growth. In other words, the best seller badge shifts the demand curve in the brands’ favor, creating a “halo effect” from the promotion or price change.
- Prime Day ’23 findings: Prime Day ’23 was more promotional than last year, with 18% of products on discount versus 14% in ’22 (+24% y/y increase). In addition, the depth of promotion was larger at 33% in ’23 vs. 28% in ’22 (+19% y/y increase). As we’ve written about previously, innovation or great deals are resonating the most for an inflation-impacted consumer. The strong consumer response to Prime Day ’23 suggests the holiday period is gearing up to be much more promotional than last year, and advertising demand is expected to be as well based on Stratably’s research amongst consumer brands.